 |
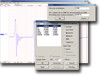
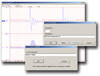
| Setup |
| Double-click and enter the channels you want to acquire into the WinDaq scan list. Click to select gain, signal averaging, and peak or valley detection per channel. Click to define a single to 32-channel display, either triggered sweep (oscilloscope-like), or scrolling (chart recorder-like). Click again to define a sample rate ranging from less than one to 250,000 per second. With WinDaq/Pro+, you can even define different sample rates on a per channel basis. |
|
 |
| Calibrate |
| Define a calibration per channel to display waveform values in meaningful units such as psi, °F or °C, amps, rpm, watts, horsepower — any unit of measure you need. |
|
 |
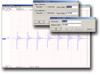
| Record |
| Choose the continuous waveform recording mode, or the triggered mode with selectable trigger level, slope and pre- and post-trigger times. WinDaq automatically time- and date-stamps, then streams acquired data to disk -- record as much data as you need. At the same time, WinDaq supplies a real-time graphical display of any or all channels so you always know where you are and where you're going. WinDaq allows you to record to disk up to 240 channels, and display up to any 32 at the same time. |
|
 |
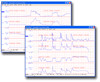
| Annotate |
| Of course, you can label any channel with text that describes it — "Motor 1," "Engine Speed," "Vertical Position," etc. But WinDaq also allows you to supply commented event markers while you record - "Beginning test phase 1," "Small vibrations noticed," "Starting cool-down cycle," etc. Your comments and our acquired data combine to form a complete diary of your data acquisition session. |
|
 |
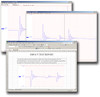
| Playback |
| Recording is only half the solution. The included WinDaq Waveform Browser playback software allows you to graphically manipulate waveforms in ways you've never seen on a PC. Compress an entire recording to one screen width for a bird's eye view, then expand around an area of interest for a closer look. Use cursors to measure amplitudes and timing with computer-precision. Move to any event marker with the click of a mouse button. |
|
 |
| Multitask |
|
Double your productivity and let WinDaq record while you review last week's results from your spreadsheet, or compose a memo with your word processor. You can even playback data already stored to disk while you're still recording.
|
|
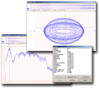 |
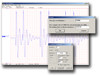
| Analyze |
| Waveform interpretation is easy with our built-in analysis functions. Apply frequency and filtering analysis with the WinDaq Waveform Browser FFT and DFT functions. Or analyze any range of waveform data with its statistics function. Use X-Y plotting to examine the relationship of one channel to another. Extended analysis functions allow waveform peak detection, integration, differentiation, arithmetic operations, and more. |
|
 |
| Export |
| The WinDaq Waveform Browser can export any range of data to your spreadsheet, or any other analysis or presentation package you use. You can even copy a graphical image displayed by the WinDaq Waveform Browser and paste it directly into a word processing document. Finally, export any range of waveform graphics to your printer for a hard copy record. |
|
| Exclusive Heads-Up Display |
| From 1 to 32 channels. Smooth scrolling or triggered sweep with level, slope and source selections. Zero plot delay for true real time performance. Active to over 250,000 samples per second and during waveform recording to disk. Control plot speed independently of sample rate. |
| Floating Tool Box of Functions |
| Provides a tool box of icons that are used to customize and setup a recording session. The icons, when selected, provide an easy way to set variable parameters such a sample rate, channel settings, display mode, etc. |
| Gap-Free Disk Streaming |
| Creates data files limited in length only by the size of your disk. |
| Real-Time Scaling |
| Scales each waveform display channel in its own unit of measure. |
| WinDaq Waveform Browser Software Included Free |
| Review and analyze your recorded data with WinDaq Waveform Browser, our playback and analysis software included free with all WinDaq software packages. Complete multitasking capability means you can literally record to and analyze data from the same file at the same time. |
| Share Recorded Files with Anyone |
| Since WinDaq Waveform Browser Software may be downloaded free from our webiste, any recorded data file may be shared with anyone, anywhere in the world. |
| Free Windaq/Lite |
| We provide WinDaq/Lite software free with every hardware purchase that does not include WinDaq/Pro+ software. |
| WinDaq/XL |
| WinDaq/XL is a software add-on to WinDaq/Lite, /Pro and Pro+ that allows data acquired by these packages to be ported to a Microsoft Excel spreadsheet in real time and on a continuous basis. |
| DADiSP |
| Extend your post processing waveform analysis capability with DADiSP software. |